Demographic Data:
Philadelphia and Northeast High School
(data, graphs and analysis)
Philadelphia's population in 1950 was over 2 million. Over 70% of the population was European American (white). By 2000, Philadelphia had less than 1.5 million people and the European and African American population was almost identical. The percentage of African American, Latino/a and Asian America students in the School District steadily increased. In 1940, 20.4% of the students in Philadelphia schools were African American. By 2001, 65.3 % of the student body was African American, 4.9% Asian American, 13.1% Latino/a, and 16.4% European American.
Northeast High School began a voluntary desegregation program in 1977 - 78 for staff and students. By 1982 - 1983, nearly 30% of the student body was African American. By 2003-2004, 30.6% students were African America and 41.1% were European American. The Asian population was 14.2% and the Latino/a population was 13.9%. Northeast continues to have a significant number of immigrant students from all around the world. (In 2008-2009, 35.9% of students were African American, 27.4% European American, 20.5% Asian American and 14.6% Latino/a.) (Data is from the School District of Philadelphia)
Northeast High School began a voluntary desegregation program in 1977 - 78 for staff and students. By 1982 - 1983, nearly 30% of the student body was African American. By 2003-2004, 30.6% students were African America and 41.1% were European American. The Asian population was 14.2% and the Latino/a population was 13.9%. Northeast continues to have a significant number of immigrant students from all around the world. (In 2008-2009, 35.9% of students were African American, 27.4% European American, 20.5% Asian American and 14.6% Latino/a.) (Data is from the School District of Philadelphia)

U.S. Census Data
Philadelphia population change
|

U.S. Census data until 1960 included a "foreign born" category. The data is separate from African American and European American though immigrants represented different regions of the world. In 1950 "other races" was included." This includes Latino/as, Asian Americans and Native Americans / Pacific Islanders. (source: U.S. Census Data)
|
From 1977-78 - 1981-82, the School District listed "racial composition" as "Black," "Hispanic" and "Other." Therefore, we don't know the exact percentage of European or Asian American students. In 1982 - 1983, students were classified as "American Indian/Alaskan, Asian/Pacific Islander, Hispanic, Black (Non-Hispanic) and White (Non-Hispanic). Therefore, in 1982 -83, 66.7% of Northeast students were "white" and 2.4% were "Asian/Pacific Islander." In 2001-02, 51.3% of the students were "white" and 10.5% "Asian." In 2002-03, 45.4% are "white" and 12.4% are "Asian." (information from "Pupil Data" files from the School District of Philadelphia)

School District of Philadelphia data
Northeast High School Instructional Staff
(Source School District of Philadelphia Data)
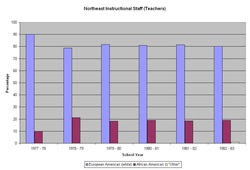
The School District from 1977-1982 listed instructional staff as "Black," "white" and "other." In 1982-83, the labels changed; staff were listed as "American Indian/Alaskan, Asian/Pacific Islander, Hispanic, Black (Non-Hispanic) and White (Non-Hispanic). In 1982-83, .08% of the staff was "Hispanic." There were no American Indian/Alaskan or Asian/Pacific islander teachers.

From: Compiled from DESEGREGATION (1974) Published by the National School Public Relations Association.
We did not find information with this map. Therefore, we aren't positive how the map was used. Nevertheless, it appears to have demographic data that could be used for the School District voluntary desegregation program. We don't know why there is a distinction between "Puerto Rican" and "Spanish Language."